
Introduction
Over the past ten years the music industry has changed drastically. Major labels have lost substantial power in building, promoting, and sustaining artists’ careers. With the advent and popularity of social networking sites, blogs, internet radio stations, and podcasts, artists are now positioned in a way that their success relies solely on them. The music industry has entered the era of the Do-It-Yourself musician. “There are over 70 million independent artists, in addition to the sizeable number of professional musicians, located throughout the United States.”[i] The vast amount of artists has made it more difficult for music consumers to find good, new artists through the clutter and has also made it extremely difficult for artists to reach them. However, an independent (or major) artist utilizing social networking and analytics has a clear advantage over competitors because of their ability to directly connect with and understand their fans on a deeper level. “The industry is fiercely competitive. The artists with access to the best market research will allow them to become leaders in their genres.”[ii]
In order for artists to establish a strategic competitive advantage they must have a website (that displays information about themselves and what they do, samples and streams of their music, a direct click button to purchase merchandise and music on each page, a regularly updated news section or blog, a mailing list sign up widget, tour dates, press kits, photos, videos, and links to each of their respective social networking sites, as well as, information that outlines reasons for visitors to make repeat visits to the site) and pages on social networking and video sites—like Facebook, MySpace, Twitter, and YouTube. All artists must also try to secure a .com domain name. By having a .com domain name the artist’s site will be indexed higher in search engines because of the higher relative importance assigned to it above all other domain names. By establishing a large digital presence, artists are more likely to attract and retain fans (caused by forging direct relationships with them). Analytics from each of these respective sites enables the artist to, “amass a wealth of data on fans’ buying habits, preferences, shared interests, and behavior,”[iii] thus enabling the artist to make more money.
The intention of this paper is to educate and inform artist managers and do-it-yourself musicians about web analytics and how its use can be applied to benefit artists’ careers. Issues that will be addressed are: (1) how utilizing analytics can increase an artist’s fan base and brand image, and (2) how analytics can be used to directly connect with an artist’s fans on a more personal level and (3) how the analysis of analytical data can help maximize the efficiency of marketing, promotional, and touring efforts. Although this paper focuses on how analytics can assist a musician’s career (and what information and statistics one should monitor) it will not address the actual process of analytics implementation.
PLEASE NOTE: Certain terminology utilized in this paper holds different meaning in the online and off line worlds. For the purpose of this paper, the words musician and artist are considered to be synonymous with one another, as are the words visitor and user (unless otherwise specified). A terminology page and contextualized analytics definitions have been provided in the appendix, for review and convenience. All terminology listed in the appendix will be highlighted in bold throughout the body of this paper.
Major companies in the music industry recognize the high value of analytical data, when it comes to assisting artists’ careers, and have implemented their own artist centric analytics and analytics assistance programs to enable artists to utilize the data effectively, assist with promotional, marketing, and touring efforts, as well as, to help the artist to increase and further develop their band-fan relationship. Listed below are some of the major companies that have developed these programs along with the respective services offered to artists.
The Orchard
“The Orchard is an independent music and video distributor specializing in comprehensive digital strategies for content owners.”[iv] On 3/18/10 The Orchard unveiled its, “interactive analytics tool within its client workstation. The tool uses daily and weekly sales activity generated from The Orchard’s top digital retail partners, including iTunes, eMusic, Verizon Wireless, 24-7 Entertainment, Deezer, and YouTube, to display full-scope sales information on specific releases through charts, line graphs, and an interactive heat map.”[v] The analytics tool helps its clients (indie artists, indie labels, and major labels) monitor sales and purchasers’ demographic data on, “album and track downloads, track and video streams, video downloads, and ringtones”[vi] by breaking them down by the, “(1) type of transaction, (2) time period of the transaction, and (3) the location of the purchaser.”[vii] The Orchard’s goal in implementing this tool for its clients is to help them more effectively target their marketing and touring strategies, as well as, is to help increase their clients’ physical sales and assist in developing more effective radio campaign strategies.
Top Spin
Top Spin monitors Google Analytics and social networks (via widgets) on behalf of their clients (artists). The Company provides report outs, analyses, and insights (actionable steps), so that artists may improve their marketing, promotional, and touring efforts, and establish more direct connections with their fans. Top Spin also tracks the effectiveness of the artist’s marketing campaigns in driving sales.
Big Champagne Media Measurement (BC Dash)
Big Champagne’s BC Dash program monitors sales, radio play, page views, and digital streams for major artists. They focus on obtaining data from internet and terrestrial radio stations, social networks, streaming and subscription services, music video websites, and digital download sites.
The Echo Nest
The Echo Nest tracks the amount of online publicity an artist receives. Through their “Fanalytics,” application Echo Nest tracks blog posts, artist news postings, artist and album review postings, social media site activity, as well as, video and mp3 postings about a client artist.
Rock Dex
Rock Dex tracks data from all major music and social networking websites. Rock Dex collects blog post information, fan connection statistics, page view data, tweet data, and song play data on behalf of its client artists.
Although these are a few major music companies that see the benefits in utilizing analytics to promote and sustain an artists’ career, there are many other companies that focus on providing artists and industry professionals with analytics data (Next Big Sound, RapLeaf, Trendrr, Band Metrics, and Music Metric to name a few). The remainder of this paper focuses on how do it yourself artists and artist managers can implement, utilize, and understand the benefits of analytics, in relation to achieving the artist’s career goals.
| Analytics Defined |
“Analytics are a subset of what has come to be called Business Intelligence— a set of technologies and processes that use data to understand and analyze business performance.”[viii] Analytics is the, “extensive use of data and fact based management to drive management decisions and actions.”[ix] Web analytics, simply defined, is the collection and analysis of website user data to drive business decisions.
Utilizing web analytics is a three-pronged process. It involves: (1) collecting statistical data from an artist’s website (or social networking sites), (2) interpreting that data, and then (3) utilizing that data to formulate decisions (concerning content improvements, marketing and promotions efforts, and how to (ultimately) generate higher returns on investment).
PLEASE NOTE: “Analytics themselves don’t constitute a strategy, but using them to optimize business capabilities is.”[x] In other words, if analytics data is only collected and analyzed and nothing is done to utilize that data, no analytics strategy exists and the collection and analysis efforts for that data served no purpose, were a waste of time, and won’t help anyone.
| What is analytics and what can it do for an artist’s career? |
Analytics provides an artist or artist manager with statistical data about the visitors of the artist’s digital properties (including their website and respective social networking sites). It provides user demographic and geographic data, as well as, displays data about how users accessed the site and provides insight into visitors’ purchasing behavior. Analytics also provides site visitor usage data. It presents information regarding the average time they spent on the site, how long after entering the site they left (bounce rate), and which pages on the site obtain the most traffic. Tracking analytics data also enables one to find site errors (which shows issues that visitors experienced while utilizing the site), determine the effectiveness or ineffectiveness adding new or additional content on the site, and displays which products have the highest conversion rates (visits/sales), and allows for an extensive evaluation of whether or not the artist’s digital properties are improving their overall business.
Monitoring analytics data can help to identify cross-promotional and selling opportunities and also helps one determine whether marketing and promotional efforts are or aren’t working as anticipated. This paper will discuss the most important reports that must be monitored when using Google Analytics, however additional Google Analytics reports (that were not mentioned) and brief descriptions of them can be found in the appendix.
PLEASE NOTE: Social networking sites (like Facebook and MySpace) are in the introductory stages of implementing analytics on their sites for their users. The data shown and reports generated are consistently changing, in order to improve and optimize data interpretation.
| The Purpose of Analytics |
The purpose of utilizing analytics is to gain a better understanding of an artist’s digital consumer base. Monitoring the users of each digital property belonging to the artist provides insight into their behavior. Understanding consumer behavior is key in promoting and selling any product or service. It enables one to make wiser decisions about the kinds of marketing, touring, and promotional efforts that should be undertaken, it helps one to better determine the timing of campaign launches, and helps one evaluate their product and service offerings (whether they should stay the same, be expanded upon, or be re-developed).
Gaining a deeper understanding of the consumer also provides insight into their purchasing decision making processes. It helps to define exactly what their needs and desires are, their personalities, lifestyles, socio-economic, ethnic, and cultural backgrounds and how all of these factors affect their purchasing decisions. Having a true understanding of one’s consumers allows for marketing and promotion efforts to become more targeted and effective, sales increases, and consumer base growth. Analytics helps take some of the guesswork out of determining consumer behavior. It tells the story of the who, what, where, when, why, and how of an artist’s following which, in turn, provides insight into their consumers’ purchasing decisions. The interpretation of analytics data shows how these things all factor into their behavior as a consumer and how understanding them can be used to benefit the artist.
| The Benefits of Utilizing Analytics |
The benefit of utilizing analytics, as mentioned above, is gaining a deeper understanding of one’s consumer and their behavior. Analytics provides the following information about an artist’s website and website visitors:
- Where site users are from
- How visitors found the site
- What visitors thought of the site
- If visitors encountered any problems while utilizing the site
- Whether or not promotional efforts are working
- What the overall benefit of the site to the artist’s career is
As noted in the “Analytics Defined” section of this paper, analytics provides a wealth of statistical data about an artist’s website. In this section the most important statistical data to track will be defined and explanations as of to why this particular data is important to track will be provided. This section will also address how to find the data in Google Analytics software, as well as, will show how to interpret the data so that beneficial site changes can be implemented. This particular section will only discuss how to use and interpret data from the artist’s personal website. The utilization and interpretation of analytics derived from social networking sites (Facebook, MySpace, and Twitter) will be addressed later in the paper (in the section called “Sites That Analytics Can Be Tracked From).
PLEASE NOTE: Prior to utilizing analytics, to determine the effectiveness of an artist’s website, a clear understanding of the purpose that the website serves for the artist must be determined. Without establishing goals and the purpose of the artist’s site, all of the benefits from utilizing analytics will not be realized. For most artists, the purpose of the website is to inform fans and potential fans about themselves (their background and history, upcoming shows, and other relevant news), as well as, is to sell albums and other assorted merchandise. The information provided below will assist with the understanding of analytics’ relationship to the purpose and goals of the artist’s website.
| Where Site Visitors are From & How They Found the Artist’s Site |
| Identifying Visitors’ Geographical Location |
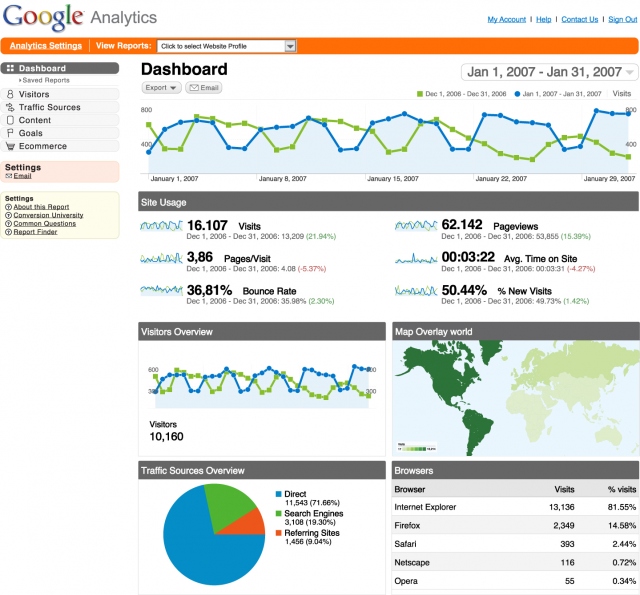
Analytics allows for the identification of where (geographically) visitors of an artist’s site are coming from. There are many benefits, outlined below, to knowing where those visitors are from. Analytics capture visitors of the website’s IP address, which provides information about where they are located in the world. One of these reports also utilizes a world map, to depict where visitors are coming from, for quick, “at a glance,” data interpretation.
By identifying where visitors are coming from (geographically), insight is gained about where marketing and promotions efforts will be most effective. It will also show potential new regions for the artist to focus on touring in, thus helping to stimulate revenue from areas that were once thought to be unlikely revenue stream sources. Insight will also be gained regarding changes that should be made to the site, as it relates to language interpretation. For example, if it is determined that many site visitors come from Brazil, adding the option of the site being translated into Portuguese might be considered (to make the site more user friendly for Brazilian visitors). Recognizing seemingly small things like this will help create an easier and more pleasant user experience on the site, which will help to further engage those visitors and potentially increase conversion rates.
Reports Used to Find This Data:
- Map Overlay—This report displays site visitors based on country, territory, and city level.
- Data Shown By Country, Territory, and City Level Are As Follows:
- The total number of visits
- The number of pages per visit
- The average time a user spent on the site
- The percentage of new visits to the site
- The bounce rates per country/territory and city
- Data Shown By Country, Territory, and City Level Are As Follows:
- Languages—This report displays the languages that visitors of the artist’s site speak.
- Data Shown By Language Are As Follows:
- Which languages are spoken the most by visitors
- The total number of visits
- The number of pages per visit
- The average time a user spent on the site
- The percentage of new visits to the site
- The bounce rates per country/territory and city
- Data Shown By Language Are As Follows:
| Identifying Where Visitors Came From On The Internet |
Although this sounds exactly like what was previously discussed, this section addresses different analytics tools and benefits. In the preceding section the focus was on where visitors were coming from geographically. This section addresses where they came from online, how they found the artist’s website, and the importance of knowing which online portals drove them to the site.
By identifying how visitors found the artist’s site, one will be able to determine which users directly entered the site, which ones used a search engine, which sites referred the visitor to the artist’s site, as well as, which marketing and promotional campaigns effectively drove them to the site. There are four ways users can find any website: directly, through referring URLs, through search engines, and through alternative methods (like email, digital newsletters, and direct online and offline marketing campaigns). There are many benefits of knowing how visitors found the artist’s site. Although the benefits will be described in more detail below, some major benefits are: being able to understand how many true fans the artist has, which search engines the website should be optimized for, potential marketing relationship leads, and how effective select promotional efforts are.
| Users Who Enter The Artist’s Site Directly—“Direct Traffic” |
Direct traffic users are (typically) already familiar with the artist and are fans of the artist. They have, most likely, bookmarked the webpage or have memorized the site’s URL. These users may also have been driven to the site by word of mouth through existing fans (who provided individuals with the direct URL) or were driven to the site by some form of offline promotion that had the artist’s web address on it (ex. flyers, postcards, advertisements, etc.).
A user who is categorized as being “direct traffic,” physically typed the artist’s website URL into their web browser. These users did not click on a link or utilize a search engine to find the artist’s site (they, somehow, already knew how to find it). Direct traffic reports tell how many users of the site came to it directly by typing the URL into their web browser. It also provides the percentage of direct traffic that the site generated in comparison with the other methods in which traffic is directed to the site.
The benefits of knowing how much direct traffic the site receives is two fold. It helps create a better understanding of how many fans the artist has (just by counting the number of direct visits to the site) and it also helps one understand how effective the artist’s offline advertising is (through knowing the bounce rate from direct traffic users). A low bounce rate from direct traffic illustrates that visitors came to the site and got what they were looking for.
Reports Used to Find This Data:
- Traffic Sources/Direct Traffic—This report displays how many visits were driven by directly typing the artist’s website URL into web browsers.
- Data Shown In This Report Is As Follows:
- The number and percentage of visits driven by direct traffic
- The average amount of time spent on the site by direct traffic visitors
- The average bounce rate of direct traffic visitors
- The average number of pages per visit of direct traffic visitors
- The percentage of new visits driven by direct traffic
- Data Shown In This Report Is As Follows:
| How Many Fans The Artist Really Has |
By understanding the number of direct visits to the artist’s site, one can learn about how large the artist’s fan base is, which helps to establish a benchmark number. Establishing a benchmark number of visitors that came from direct traffic helps one monitor the effectiveness of marketing campaigns.
**Remember that results can’t be seen from utilizing analytics or from tracking marketing and promotional efforts, unless a baseline number of visitors who were coming to the site (via direct traffic), prior to their implementation, is known. **
By establishing this initial benchmark, one can notice immediately if the artist’s fan base has increased and if the promotional and marketing efforts are benefitting the artist (this can be done by checking to see if the number of direct visits to the page has increased or stayed the same—this number should not decrease unless something drastic is done on the site to alienate visitors).
| How Effective Offline Marketing & Promotional Efforts Are |
Determining the bounce rates from direct traffic gives key insights into how effective the website is in retaining users who have received or been exposed to the artist’s offline marketing and promotion efforts. If a user is directly typing the URL into their browser (and are not frequent visitors like fans are), they were most likely exposed to some form of offline marketing. If they visit the site and leave it within 10 seconds of accessing it (a.k.a. bounce rate), their perception of what they had expected to see or get was far different from what they actually received from the site’s content. Their quick exit from the site shows the difference between what they thought they would access and what they did access.
If a high bounce rate, from direct users, is noticed promotional and marketing efforts, with regard to how they relate to the artist’s website, must be re-evaluated. Some key questions to ask, when a high bounce rate from direct traffic is realized, are as follows:
- Do the artist’s offline marketing materials promise something that the website doesn’t deliver—hence providing the visitor with the wrong impression when they visit the site—which causes them to immediately leave?
- Is the site as graphically and visually appealing as the offline promotional materials?
- Are they cohesive and do they project the same theme and evoke the same emotions from the visitor?
- Does the brand image conveyed on the offline promotional materials match the image projected on the website (i.e. do the off line promotional materials project professionalism while the website projects an image of immaturity and carelessness)?
These are some of the questions that should be asked when a high direct visitor bounce rate is noticed. Asking and answering these questions will help to identify and remedy any inconsistencies between the artist’s site and offline promotional and marketing efforts and will also help to reduce future bounce rates from direct traffic.
| Referring URLS |
Users who enter the artist’s site through referring URLs are users who were directed to the website via another website they visited. Referring URLs are other URLs (websites) that directed their traffic to the artist’s website. Referring URLs can be obtained through affiliate marketing, link building, and paid search campaigns. Below is a description of each type of referring URL, followed by what reports data is obtained from, as well as, what the referring URL reports illustrate about each type of referring URL (and campaign) and how the data can be utilized to benefit the artist.
| Affiliate Marketing Campaigns |
Affiliate marketing, at its core, is the use of one website to drive traffic to another related website. In affiliate marketing, companies establish relationships with one another to increase the number of visitors on the one company’s (usually a merchant’s) site. In affiliate marketing, the merchant pays the affiliate money to post an ad on their (the affiliate’s) site. The money the merchant pays to the affiliate is commission based, with payment relying solely on the affiliate website’s ability to successfully drive traffic to the merchant’s site and subsequently stimulate the merchant’s sales.
The benefit of participating in an affiliate marketing program is that it enables the merchant to reach a broader audience (which stimulates sales inquiries, thereby increasing sales). One caveat about affiliate marketing is that in order for it to work successfully, affiliates must have the same (or very similar) target markets as the artist’s site (otherwise people will ignore the artist’s ads on the affiliate’s site or the artist’s website bounce rate will severely increase).
| Link Building Campaigns |
Link building is the process of having another website post a link to a site on their webpage and vice versa. Link building is free; it centers around establishing relationships with companies, blogs, and websites that feature content that is similar to the content featured on the artist’s site. By establishing these free relationships, consumers are driven to new sites that feature content that is of interest to them. Because the content on linked sites appeals to similar target markets, link building significantly increases traffic to the artist’s site. The similarity between target markets causes the artist’s site to achiever higher search rankings and also directly correlates with having a decreased bounce rate (because the content on the artist’s site matches what the visitor is interested in).
Another benefit of link building campaigns is that it helps to increase the artist’s site’s visibility in search engines (through the utilization of keywords, keyword phrases, and multiple domain name mentions—the more links to the page, the higher the search engine spiders and bots rank the artist’s site). Search engines look at internal, inbound, and outbound (external) links when indexing the artist’s site and each of its respective pages. Internal links make it easier for the user to find the content they desire on the artist’s site. When dealing with internal links, all links to each page on the artist’s website must be appropriately connected, otherwise the search engine bots won’t accurately index the site.
Inbound links help search engine bots determine the ranking of a website in search engine results pages. The more links there are directing traffic to the artist’s website increases the site’s page ranking in search engines, due to its perceived importance and popularity. Outbound links, on the other hand, are links on the artist’s site that direct traffic to other, similar, websites. These links typically do nothing to increase the artist’s page rank but serve as a form of in kind payment to those sites that are directing traffic to the artist’s site (hence the term link swap).
PLEASE NOTE: Link farms should not be used when establishing inbound link building campaigns. The reason for this is that search engine bots are aware of these link farms and will treat inbound links to pages from them as spam (therefore doing nothing to increase the artist’s page’s rank). Aside from the bots not indexing the page, by ignoring it, the bots will penalize any site that attempts to establish inbound links through link farms (and will prevent non-link farm inbound links from increasing the artist’s page rank as well). Once a website has been penalized, it is almost impossible for the penalty block to be removed.
Be sure to keep track of which websites that link swaps were arranged with. The reason why this must be done is to see how effective each of the sites are at driving the appropriate traffic to the artist’s site. Evaluating bounce rates and the time visitors spent on site driven from each external link will assist in gaining an understanding of which relationships are the most important to maintain and will also help to determine why other link partners aren’t as successful at generating returns for the artist’s site. If it is discovered that certain link partners aren’t as successful as others, the following questions should be asked:
- Do they have a different target market than the artist?
- Are their sites irrelevant—because their content isn’t related enough to the artist’s site?
- If it is determined that some or all of the sites are irrelevant, should the link building campaign relationship be maintained?
| Referring URL Report Benefits & Data Interpretation |
Reports Used to Find This Data:
- Referring Sites—This report displays data for all URLs that refer traffic to the artist’s site.
- Data Shown In This Report Is As Follows:
- How data relates to goal conversions and e-commerce (tabs must be used)
- Detail (by clicking on each referring URL link) about the referring site
- Data Segmentation (via the “segment” drop down menu
- The amount of traffic driven by referring sites
- The number of referring site sources that drove traffic to the artist’s site
- The percentage of total visits to the site driven by referring URLs
- The average amount of pages per visit driven by referring URLs (a site average comparison percentage and site contribution total percentage is given alongside this number)
- The average amount of time visitors spent on the site per visit driven by referring URLs (a site average comparison percentage and site contribution total percentage is given alongside this number)
- The percentage of new visits driven by referring URLs to the site (a site average comparison percentage and site contribution total percentage is given alongside this number)
- The bounce rate of referring URL visitors (a site average comparison percentage and site total contribution percentage is given alongside this number)
- Each individual referring site name (up to 500 sites can be viewed)
- The respective number of visits driven by that particular referring site
- The respective number of pages per visit driven by that particular referring site
- The respective average time spent on the site per visit driven by that particular referring site
- The respective percentage of new visits driven by that particular referring site
- The respective bounce rate for visits driven by that particular referring site
- Data Shown In This Report Is As Follows:
This report also helps with understanding which referring URLs came from paid vs. non-paid visits. Having this data helps with the understanding and evaluation of whether paid search and affiliate marketing efforts are actually helping to increase visits to and sales on the artist’s site. If it is noticed that the majority of traffic is coming from non-paid sources, it would be wise to decrease or cease paid campaign efforts. Knowing this will help with the proper appropriation of marketing funds. Paid search campaigns and reports will be discussed in more detail in the next section.
When viewing the Referring URLs report, close attention should be paid to unfamiliar referring URLs. If the URLs are unfamiliar, visit them and determine why they might be directing traffic to the artist’s site. For those unfamiliar URLs, that send a high volume of traffic to the site (coupled with high conversion and low bounce rates), establishing an affiliate marketing or link building relationship with them should be considered. If it is noticed that sites, that have similar target markets as the artist, aren’t referring traffic to the site, it would be wise to consider reaching out to them (regarding embarking on a campaign with them). These sites would be those, which have been determined to be worthy referring URLs because the artist’s content and product offerings are related and establishing a relationship with them would be mutually beneficial. Another thing that close attention should be paid to is the artist’s main competitors’ referring URLs. This information can be found at Compete.com or Quantcast.com—given that the artist’s competitors have implemented analytics on each of their respective sites. By knowing which sites refer traffic to the artist’s competitors, it can be determined how many of those same referrers are also Referring URLs to the artist’s site, as well as, allows for the development of Referring URL leads (sites that might be worth targeting to build relationships with in the future).
When referring URL reports are viewed, be sure to look beyond the top 10 referring URLs. This will help in determining what other top referring URLs are. Doing this will also help determine the quality of the traffic being driven to the artist’s site (based on bounce and conversion rates) from each referring URL and can also help to determine which campaigns (paid searches, affiliate marketing, link building) have worked best, as well as, will help determine which campaign type(s) will be the most important to focus on continuing or establishing in the future.
PLEASE NOTE: Search engine bots will not be listed in Referring URL reports. The reason for this is because Google Analytics operates using JavaScript. Since search engine bots don’t utilize JavaScript to index sites, bot visits are not factored in to any Google Analytics reports. Google and the other top search engines do, however, have special “webmaster” tools (separate from Google Analytics) that allow the artist to identify how these search engines index their site. Viewing the Crawl Stats report, in the “webmaster” tools application, provides data about the activities of each search engine’s bots. Knowing how frequently the search engine’s bot visits the site helps to establish a baseline of when the artist’s search engine page rank will increase, especially if changes were made to the site (in hopes of increasing the page’s ranking). Recognizing that these search engine bots have visited the artist’s site, but did not increase the artist’s page ranking, will help with tailoring the artist’s SEO strategy towards identifying how to obtain a higher page ranking in that particular search engine.
| Paid Searches |
Paid searches are a type of contextual advertising. Contextual advertising is a form of targeted advertising on search engine websites, where the keywords attached to the artist’s AdWords campaign (in association with the website) influences the types of ads that appear to viewers on the search page (based on matching keywords). In paid searches, website owners pay to have their website appear at the top sidebar of search engine result pages. The way this works is through a bidding/algorithm system. The artist, manager, or webmaster places a bid on select keywords that they want to be associated with the artist’s site and then pays the amount of money they bid on that keyword to Google or another search engine company. If the artist engages in a pay per click (paid search) campaign from another search engine, the artist must tag/set up those campaigns properly in their Google Analytics account (otherwise the data for those campaigns won’t be tracked) Other individuals are allowed to bid on keywords the artist selects for their site as well (if they feel that it also matches their site content). An algorithm is then applied based on the keyword bids and the keyword bid competition. This determines where the artist’s ad gets listed on the search engine’s results page (whenever an individual searches using that particular keyword). These factors determine the placement of the artist’s ad on the search engine’s page (i.e. the more money paid for the keyword, the more visible the ad’s placement will be).
Website owners are willing to pay for this service because it increases their site’s visibility and online presence to individuals seeking items that match with select keywords. By investing in a paid search, the goal is that (due to increased visibility of the website) a larger volume of traffic will be directed to it and increase sales.
Reports Used to Find This Data:
- Ad Words Campaign Report—This report shows the performance of the artist’s AdWords campaigns.
- Data Shown In This Report Is As Follows:
- From the Site Usage Tab
- Number of Site visits driven by AdWords campaign
- How many pages were visited by users who were directed to the artist’s website via AdWords
- How long the users who were directed to the artist’s website via AdWords spent on the site
- How many visitors directed by the AdWords campaign were new visitors
- The bounce rate of traffic directed to the site by the AdWords campaign
- From the Clicks Tab
- From the Site Usage Tab
- Data Shown In This Report Is As Follows:
- The number of impressions (how often the artist’s ad appeared on search engine users’ search screens)
- Cost of AdWords clicks
- Click Through Rate (the percentage of impressions that facilitated visits to the artist’s site via the AdWords campaign)
- Cost Per Click (average cost of an AdWords click)
- Revenue Per Click (average revenue received via AdWords clicks)
- Return on Investment (the value of the AdWords campaign relative to the artist’s goals and monetary investment in the campaign)
- Product margin percentage (how much money is the artist making after deducting how much the products cost to make coupled with the cost of the AdWords campaign)
- AdWords Ad Groups Report—This report shows the performance of the artist’s individual AdWords campaigns. The AdWords Campaign Report is a comprehensive report displaying data for all AdWords campaigns that the artist is currently running. This report focuses specifically on single keywords used in AdWords campaigns.
- Data Shown In This Report Is As Follows:
- Shows data specific to each individual keyword used in an AdWords campaign
- The number of impressions (how often the artist’s ad appeared on search engine users’ search screens)
- Cost of AdWords clicks
- Click Through Rate (the percentage of impressions that facilitated visits to the artist’s site via the AdWords campaign)
- Cost Per Click (average cost of an AdWords click)
- Revenue Per Click (average revenue received via AdWords clicks)
- Return on Investment (the value of the AdWords campaign relative to the artist’s goals and monetary investment in the campaign)
- Product margin percentage (how much money is the artist making after deducting how much the products cost to make coupled with the cost of the AdWords campaign)
- Data Shown In This Report Is As Follows:
- Content Targeting & Keywords AdWords Report—This report displays more detail about the individual keywords involved in the campaign.
- Data Shown In This Report Is As Follows:
- Shows data specific to each individual keyword used in an AdWords campaign
- The number of impressions (how often the artist’s ad appeared on search engine users’ search screens)
- Cost of AdWords clicks
- Click Through Rate (the percentage of impressions that facilitated visits to the artist’s site via the AdWords campaign)
- Cost Per Click (average cost of an AdWords click)
- Revenue Per Click (average revenue received via AdWords clicks)
- Return on Investment (the value of the AdWords campaign relative to the artist’s goals and monetary investment in the campaign)
- Product margin percentage (how much money is the artist making after deducting how much the products cost to make coupled with the cost of the AdWords campaign)
- Data Shown In This Report Is As Follows:
Utilizing Google Analytics’ AdWords Campaign Report helps to calculate the cost per impressions statistic for paid search campaigns. After obtaining and reviewing this statistic, it can be determined whether or not the cost of running the campaign outweighs the benefits. This will help to determine whether or not paid search campaigns should continue to be run in the future. The AdWords Campaign report, in conjunction with Google’s Insights For Search report, can help to optimize referrer effectiveness and increase the amount of referring URLs directing traffic to the artist’s site. These reports also help to identify keywords (that potential visitors of the site would employ, in order to find the artist and their products) that could be used in the campaign. This will help to optimize the effectiveness of AdWords’ keywords and will assist in obtaining a higher amount of searches for the artist’s site and products (thus stimulating page views and potential sales).
| Search Engine Referring URLs |
It is extremely common that the majority of visitors, who came to the artist’s site, were directed to it through a search engine. Search engines are websites that enable a user to type in keywords and phrases to find some type of data on the internet (be it music, information, movies, etc…). Currently, the most popular search engines that individuals utilize are: Google (49%), Yahoo (24%), MSN (10%), and Ask (3%).
There are a variety of benefits one gets from reviewing what the top search engine referring URLs are. Firstly, if it is known which search engines drive the most traffic, there will be a better understanding of which search engines the artist’s site should be optimized for. Reviewing this data also helps to determine the artist’s website’s overall presence online (based on its relative rank in each search engine). Knowing how the artist’s website is ranked in search engines helps provide insight into what SEO strategies need to be pursued and also helps provide insight into what changes need to be made to the site to make it more predominant on the web—it helps with understanding what strategies need to be pursued to optimize its visibility (if the site is not currently ranked at the top of the page across all major search engines).
If it is noticed that the site has a low percentage of traffic driven by search engines, the data is stating that something is wrong with the artist’s website. It could mean that not enough link building or affiliate marketing campaigns are in place (which increase search rankings), it could mean that the keywords and phrases attached to each page of the site need to be expanded upon (in order to increase search result rankings), and it could also mean that the meta tags on the site don’t properly match the content featured on the site (which causes the website to be indexed improperly in search engines).
If a low percentage of traffic is driven to the artist’s site by search engines, the website should be adjusted to include more appropriate keywords and meta tags and serious consideration must be given to increasing the site’s link building and affiliate marketing campaigns. If doing these things still does not increase the percentage of traffic driven to the website by search engines, a full SEO (Search Engine Optimization) strategy should be pursued. Once a full blown SEO strategy is embarked upon, search engine rankings will drastically increase, thus increasing the percentage of traffic driven to the artist’s website through them. SEO strategies will be addressed in more detail in the following section.
Reports Used to Find This Data:
- Search Engine Traffic Source Report—This report displays the amount of traffic driven to the artist’s website via search engines.
- Data Shown In This Report Is As Follows:
- The percentage of total visits to the site driven by search engines
- The average amount of pages per visit driven by search engines (a site average comparison percentage and site contribution total percentage is given alongside this number)
- The average amount of time visitors spent on the site per visit driven by search engines (a site average comparison percentage and site contribution total percentage is given alongside this number)
- The percentage of new visits driven by search engines to the site (a site average comparison percentage and site contribution total percentage is given alongside this number)
- The bounce rate of search engine visitors (a site average comparison percentage and site total contribution percentage is given alongside this number)
- Each individual search engine’s name (up to 500 sites can be viewed)
- The respective number of visits driven by that particular search engine
- The respective number of pages per visit driven by that particular search engine
- The respective average time spent on the site per visit driven by that particular search engine
- The respective percentage of new visits driven by that particular search engine
- The respective bounce rate for visits driven by that particular search engine
- Data Shown In This Report Is As Follows:
Aside from showing the percentage of traffic driven to the site by search engines, the Referring Sites report also shows the percentage of traffic (and a brief overview of the quality of that traffic) driven by search engines compared to the traffic driven by other site referrers.
A few key questions that should be focused on when viewing the Search Engine Traffic Source Report are as follows:
- Is the site actually showing up in search engine results?
- What are the most important key phrases and terms that describe the artist’s website and each respective page on it?
- Do the keywords and phrases associated with the artist’s site appropriately reflect and match the content on it?
- Are the appropriate meta tags set up on each page of the artist’s website?
| SEO & Search Engine Traffic |
SEO focuses on learning about how search engines work and what individuals look for when running their search engine queries. SEO deals with improving the volume and quality of the traffic that a website receives. In order to obtain the best possible results from search engines, some form of SEO must be pursued. Search engine optimization focuses on the enhancement of a website through editing the website’s content and HTML coding. SEO helps to increase the site’s association with specific keywords (when returning search engine user queries) and will also help to remove any barriers on the website that will prevent spiders or bots (search engine indexing tools) from properly indexing the artist’s site. Although SEO will not be discussed in this paper (because it is outside of its scope), a list of some of the top companies who provide SEO services and some of their respective clients are listed below.
Increase Visibility Inc.
Partial Client List:
- Farmers
- IGE
- Banana Republic
- LG
WebiMax
Partial Client List:
- Sam’s Club
- Go Big Network
- US Data Corporation
- David’s Bridal
SEOP
Partial Client List:
- TVG
- Siemens
- Vibe
SlingShot SEO Inc
Partial Client List:
- Community Health Network
- WebTrends Inc.
- ChaCha
- Interactive Intelligence
ArteWorks SEO
Partial Client List:
- SL Store Fixtures Inc.
- Bullion Direct
- All Star Directories
- Red McCombs Media
| Other Referring URLS |
Although the primary methods of how users find the artist’s site have already been discussed, it is important to touch upon some of the other methods in which users can be directed to the site. Three additional methods of attracting users to the site are through email lists, digital newsletters, and direct marketing campaigns.
| Email Lists & Digital Newsletters |
Although emails and digital newsletters are inherently different, analytics tracks them in the same manner, so they will be addressed in this section together. Email lists and digital newsletters are comprised of individuals (that either attended the artist’s shows or other events that the artist participated in, or they registered on the artist’s site to be informed about future endeavors) who have opted in to receiving communications from the artist via email. These visitors entered the site based on the links and calls to action provided in the emails or digital newsletters sent to them (i.e. they clicked on the link to the website in the email and subsequently visited it).
The effectiveness of email and digital newsletter campaigns can be tracked by looking at the Referring Sites Report. Counting the visits and email/newsletter openings (the number of times a subscriber opened the email or newsletter) generated from the campaigns can help to determine the effectiveness of that particular campaign.
If it is noticed that response rates are low (percentage of traffic driven from the email or newsletter), two things about email and digital newsletter campaign strategies can be learned. The first thing that can be learned from a low response rate is that the emails and/or digital newsletters might not have been sent to individuals in the artist’s target demographic. This means that the information isn’t reaching people who care about the artist and is treated and viewed as spam. The second thing that can be learned from this is that a stronger call to action must be positioned in the email or digital newsletter. If the call to action isn’t placed in a predominant place in the email or digital newsletter, the recipient doesn’t know that a link to the artists site even exists in the document that was sent to them.
In order to distinguish email and newsletter traffic from that of other types of referring URLs, URLs with the words email, webmail, or mail in the address must be clearly paid attention to. URLs that have those three particular key words illustrate the traffic driven to the site by email and digital newsletter referring URLs.
PLEASE NOTE: If a user has a desktop email application (like Microsoft Outlook) Google Analytics will not be able to track how many subscribers clicked on the link to the site from the email or digital newsletter and it will also not be possible to track how many times each subscriber opened the emails or digital newsletters.
Reports Used to Find This Data:
- Referring Sites—This report displays data for all URLs that refer traffic to the artist’s site, including links from emails and digital newsletters.
- Data Shown In This Report Is As Follows:
- How data relates to goal conversions and e-commerce (tabs must be used)
- Detail (by clicking on each referring URL link) about the referring site
- Data Segmentation (via the “segment” drop down menu
- The amount of traffic driven by referring sites
- The number of referring site sources that drove traffic to the artist’s site
- The percentage of total visits to the site driven by referring URLs
- The average amount of pages per visit driven by referring URLs (a site average comparison percentage and site contribution total percentage is given alongside this number)
- The average amount of time visitors spent on the site per visit driven by referring URLs (a site average comparison percentage and site contribution total percentage is given alongside this number)
- The percentage of new visits driven by referring URLs to the site (a site average comparison percentage and site contribution total percentage is given alongside this number)
- The bounce rate of referring URL visitors (a site average comparison percentage and site total contribution percentage is given alongside this number)
- Each individual referring site name (up to 500 sites can be viewed)
- The respective number of visits driven by that particular referring site
- The respective number of pages per visit driven by that particular referring site
- The respective average time spent on the site per visit driven by that particular referring site
- The respective percentage of new visits driven by that particular referring site
- The respective bounce rate for visits driven by that particular referring site
- Data Shown In This Report Is As Follows:
| Direct Marketing Campaigns |
With direct marketing, messages are being targeted and sent directly to potential consumers and fans. This usually takes the form of direct mail, email, newsletters, and telemarketing and is an unsolicited method of reaching potential consumers. This is one of the least effective methods of promotion and it should be expected that response rates will be low.
Although emails and newsletters were mentioned before, those were not sent without the recipient opting into it in some manner. Therefore, email and newsletters from direct marketing (in this particular context) relate specifically to unsolicited direct contact with potential consumers. The success of email and newsletter direct marketing campaigns, in analytics is measured in the same manner that was mentioned above. The only difference is that because the emails and newsletters sent to them were unsolicited (meaning the recipients weren’t subscribers) the option of monitoring whether or not they opened what they received is not available.
When dealing with offline direct marketing (like mailings and telemarketing efforts) the only way of monitoring its effectiveness (with analytics) is by noting the number of “Direct Traffic” visits to the site because the visitor (as previously mentioned) had to physically type the website’s URL into their web browser.
| What Visitors Thought Of The Artist’s Site (A.K.A. Site User Feedback) |
Utilizing analytics on the artist’s site can provide useful feedback about what visitors actually thought of their experience on it. Listed below are some of the key pieces of data that help one learn about visitors’ opinions of the site, how to access that data, and how to interpret it (so that the site may be optimized to make the visitors’ experiences easier and more enjoyable). Analytics enables one to learn about visitors’ opinions by providing the following data:
- The bounce rate (of the entire site and each respective page)
- The duration of time spent on the site
- What the most popular (highest trafficked) pages on the site are
- Conversion rates
- Click density
- The number of returning visitors
- The number of days the site was viewed prior to the purchase of the artist’s product(s)
- What the artist’s top selling product(s) are and the average value of each order
| Bounce Rate |
The bounce rate is the percentage of visitors who enter a site and leave, within ten seconds, to go to another site (rather than continue on to other pages on the artist’s site). Bounce rate statistics show how sticky the artist’s site and each of its respective pages are.
If the artist’s site has a high bounce rate (over 35%), it signifies that something is wrong with the site. It might mean that visitors expected something different than what they found on the site (or specific pages on the site), it might mean that the content isn’t captivating enough, and it also might mean that the layout and navigation of the site makes it difficult to find the information visitors are searching for.
If it is noticed that certain pages of the site have higher bounce rates than others, content that can be improved upon on those pages must be investigated, in order to keep visitors on those pages. After adjusting the content on those pages (and after noting their initial bounce rates) whether or not the content changes have reduced the page’s bounce rate can be viewed. If it is still found that the site’s overall bounce rate and specific pages’ bounce rates have not decreased, after implementing changes, the keywords and phrases attached to the site and each respective page must be investigated. If the keywords and phrases attached to the site or specific pages of the site are inappropriate, search engines will not properly index the artist’s site. The result of improper indexing is that individuals searching for specific content will end up on pages whose content doesn’t match what they were actually searching for (thereby causing them to initially visit and then immediately leave the site). If it is found that high bounce rates are coming from other sites that paid search, affiliate marketing, and link building campaigns have been arranged with, research must be conducted about why the artist’s website is getting high bounce rates from each of these particular sources. As previously mentioned, it is necessary to look at whether or not their target markets are different than the artist’s and if the keywords attached to the artist’s site appropriately match with those referral sites. Knowing what the artist’s bounce rate statistics are helps identify how engaging and captivating the site is to visitors.
Reports Used to Find This Data:
- Bounce Rate For All Visitors—This report displays bounce rate data by date.
- Data Shown In This Report Is As Follows:
- Total bounce rate
- Daily bounce rate
- Bounce rate trend graph
- Data Shown In This Report Is As Follows:
Aside from viewing the Bounce Rate For All Visitors report, site bounce rate information can be found by looking at most Google Analytics reports. Some examples of the bounce rate data that Google Analytics reports provide are: bounce rate statistics for each page on the site, the bounce rate for the search keywords that drive traffic to the site, as well as, the bounce rates coming from referring URLs.
| Duration Spent On Site |
This statistic helps one understand how long each visitor stayed on the site. Knowing how long a visitor stays on the site helps to determine exactly how engaging content on the site is, as well as, what their likelihood of making a purchase is. This statistic shows how sticky the artist’s site is. The longer a visitor stays on the site, the more they are interacting with its content. This illustrates how captivating and engaging visitors find the site. If it is noticed that visitors aren’t staying on the site long enough to watch a video or listen to the music on it, that particular content might need to be moved on to the home page or be adjusted so that it is more captivating. This statistic is more useful when looking at in conjunction with what the site’s top exit page is. Looking at the top exit page can help the artist determine if that particular page’s content is actually driving visitors away. If all visitors spend a short amount of time on the site, the content of the site must be re-evaluated (so that necessary changes to the content occur in order to make the site more engaging to visitors). The site design (layout) should also be re-evaluated if a short amount of time is spent on the site (in order to see if it is laid out in a confusing or inefficient manner—which consequently causes visitors to leave).
Reports Used to Find This Data:
- Length of Visit—This report illustrates how long visitors stayed on the artist’s website.
- Data Shown In This Report Is As Follows:
- The average amount of time visitors spent on the site
- The duration of visits, the number of visits that had spent that particular amount of time on the website, and the percentage of all visits that each time segment accounts for on the artist’s site
- The duration reported is divided up in to seven sections:
- 0 – 10 seconds spent on site
- 11 – 30 seconds spent on site
- 31 – 60 seconds spent on site
- 61 – 180 seconds spent on site
- 181 – 600 seconds spent on site
- 601 – 1,800 seconds spent on site
- 1,801 + seconds spent on site
- The duration reported is divided up in to seven sections:
- Data Shown In This Report Is As Follows:
PLEASE NOTE: Tabbed browsing can inflate and skew this number because many individuals will keep multiple tabs in their web browsers open, which can make the amount of time spent on site to be incorrectly reported.
| Top Content- Most Highly Viewed Pages |
Top content represents the most popular content (pages) on the artist’s site. Most likely, the most popular page will be the artist’s home page. What this means is that the home page must be optimized to drive traffic to the artist’s merchandise store and social networking sites (to increase sales and conversions of new visitors to fans). With the most highly visited page being the home page, it also has to be the most interesting page on the artist’s site (otherwise visitors won’t be intrigued or interested in perusing other pages on the site thus, reducing the amount of time spent on the site and increasing the site’s bounce rate). Another page that should also be ranked highly in top site content is the artist’s merchandise store page. The reason for this is that the artist wants to drive and increase their merchandise sales.
By viewing the top content report and noticing what the most popular pages are, the artist gains feedback on whether their website is servicing its fans properly and is effectively promoting their products. If the top site content is not the home page or merchandise page, further investigation must be done to see why the majority of traffic is going to other pages. This also provides feedback on types of changes the site must undergo in order for the artist to meet their goals.
Reports Used to Find This Data:
- Top Content—This report displays the most frequently visited/ most popular pages on the artist’s website.
- Data Shown In This Report Is As Follows:
- The number of pages that were viewed on the site and how many times they were viewed
- The number of page views of the most popular pages and the number of unique page views of those pages as well
- The total number of unique page views and percentage of site total
- The average time spent on each page and percentage of site total
- The average time spent on each of the most popular pages on the site
- The bounce rate for the entire website and for each individual page that ranks as top content
- The exit rate average percentage of each page and percentage of site total
- The exit rate for each of the most popular pages on the site
- The amount of money derived from each page and its percentage of the site’s total revenue
- The amount of money derived from each of the most popular pages on the site
- The number of pages that were viewed on the site and how many times they were viewed
- Data Shown In This Report Is As Follows:
| Site Issues |
Site issues are problems that deal with the functionality of the artist’s website. These issues are typically characterized by having broken links, pages not being found on the site and the site not functioning properly. What’s learned through identifying site issues is what problems users are experiencing on the artist’s website. If users encounter too many problems on the site, the artist won’t effectively be able to achieve their goals because they won’t be able to retain visitors or have visitors re-visit the site. Site issues will increase the site’s overall bounce rate, negatively impact the amount of time visitors spend on the site, and will produce negative consumer behavior (where they won’t re-visit the site or will generate negative word of mouth about the site and possibly the artist). By learning about site errors, artists become aware of problems and subsequently can fix them, in order to optimize and improve the visitor’s experience on the site. The top exit, bounce rate, length of visit, content drilldown, and visitor loyalty reports will help with the identification of site issues because they each illustrate visitors’ reactions to site content. The content drilldown report, through clicking on each link, will help with the understanding of which links on the site are broken.
| Conversion Rates |
A conversion rate is the rate at which visitors to a website take desired marketing actions. These visitors are said to convert from strictly consuming website content to performing some type of desired marketing action (like signing up for an email or newsletter list or making a purchase). In order to monitor the conversion rate of visitors on the artist’s website, Google Analytics requires one to set up “goals.” In order to set up “goals” on the site, the name of the goal must be entered and a quantifiable and measurable goal must be defined (ex. $500 in monthly purchases). The reason why this statistic should be monitored is because the artist must know how effective their website is at turning their visitors into purchasers of their merchandise and how effective it is at getting visitors to sign up for their email/digital newsletter lists. If it is noticed that goal conversion rates are low, investigation into why this is occurring must be done, as well as, actions should be taken to understand how to increase the site’s conversion rates (like increasing site usability, making site navigation better, and improving content that relates to conversion goals).
TIP: All artists should have links on each page of their website that direct traffic to their merch store and to their email/digital newsletter sign up lists.
Reports Used To Find This Data:
- Total Conversions—This report illustrates the number of daily goal conversions that occur on the site for each specific goal that was set.
- Data Shown In This Report Is As Follows:
- Total conversions over time (trending)
- The amount of goal conversions
- Conversions by date (including the number of total conversions and the percentage of conversions generated on the site.
- Data Shown In This Report Is As Follows:
- Goal Conversion Rate—This report illustrates the number of hourly and daily goal conversions that occur on the site, as well as, shows the percent change in goal conversions over time.
- Data Shown In This Report Is As Follows:
- Total conversions over time (trending)
- The amount (percentage) of goal conversions
- Conversions by date and by hour (including the percentage of conversions generated on the site
- Data Shown In This Report Is As Follows:
| The Number of Days & Visits Prior To A Visitor Making a Purchase |
This section addresses how many visits and days a visitor of the artist’s website must make prior to them making a purchase. Knowing how many visits must occur prior to a visitor making a purchase helps the artist understand whether or not the content on the site (and the calls to action displayed on it) is effective at getting consumers to make purchases. By understanding the amount of time it takes for a visitor to make a purchasing decision, an artist can see whether or not the visitors to their site make their purchases impulsively (and seek instant gratification) or if they delay making purchases (to think the purchase over). It can be deduced that marketing and promotional efforts on and off the site are extremely effective if most visitors who purchase the artist’s products buy on their initial site visit. If it takes more visits for a visitor to make a purchase a few things must be evaluated. Questions that must be asked are:
- How could the time to purchase ratio be improved?
- Should more information be provided about the products to drive purchases?
- Are the products featured what the majority of visitors want or feel they need?
Reports Used To Find This Data:
- Visits To Purchase—This report illustrates how many visits, visitors of the artist’s site, must be made prior to purchasing the artist’s products.
- Data Shown In This Report Is As Follows:
- The number of visits that occur prior to a visitor making a purchase
- The average number of visits that are made prior to a visitor making a purchase
- The total number of transactions per visit
- The total percentage of all purchases that each visit accounts for (over amount of visits)
- Data Shown In This Report Is As Follows:
- Time To Purchase—This report illustrates how much time visitors of the site take to make a purchase. It shows how long it takes for them to buy something from the artist’s merch store.
- Data Shown In This Report Is As Follows:
- The number of days that pass prior to a visitor making a purchase
- The average amount of time that passes prior to a visitor making a purchase
- The total number of transactions per visit
- The total percentage of all purchases that each visit accounts for (over time)
- Data Shown In This Report Is As Follows:
| Top Selling Products & Average Order Value |
These reports address which of the artist’s products in their merch store generate the most revenue. They also show what the average amount of money spent per purchase is and what the most popular products in the artist’s merch store are. Knowing this information helps the artist determine replenishment timing (when they should re-order their merch), whether or not marketing efforts are effectively driving sales, and also helps to determine what products visitors to the site are and aren’t interested in purchasing.
Reports Used To Find This Data:
- Average Order Value—This report illustrates how much money is spent, on average, per order placed through the artist’s merch store.
- Data Shown In This Report Is As Follows:
- The average order value
- The average amount of revenue generated per day
- Data Shown In This Report Is As Follows:
- Products—This report shows the amount of sales and revenue generated over time. This report breaks down sales per product sold on the site, so that the value of each product sold can be evaluated.
- Data Shown In This Report Is As Follows:
- The total amount of revenue generated through sales in the artist’s merch store
- The total amount of sales generated (by product)
- The average order price of each item purchased
- The amount and percentage of revenue generated by each product
- The number of items purchased divided up by product type
- The amount of transactions generated by each particular product
- The average order quantity of each item purchased
- Data Shown In This Report Is As Follows:
- Product SKUs—This report shows which particular products on the artist’s site generate revenue.
- Data Shown In This Report Is As Follows:
- The amount of products the artist has in their merch store
- The number of items purchased divided up by SKU (item)
- The amount of transactions generated by each particular product
- The average order price of each item purchased
- The percentage revenue generated by each SKU (item)
- The average order quantity of each item purchased
- Data Shown In This Report Is As Follows:
- Product Categories—This report displays information about which product categories generate the most revenue.
- Data Shown In This Report Is As Follows:
- The number of product categories the artist’s merch falls in to
- The most popular product categories
- The average amount of revenue generated by each product category
- The number of items sold in each product category
- The number of transactions that occurred in each product category
- The average price charged to customers per product category
- The average amount of products purchased in each category
- The percentage of total sales generated by each product category
- Data Shown In This Report Is As Follows:
| The Number of Unique & Returning Visitors |
A unique (new) visitor is defined as being an individual who accesses an artist’s site for the first time. However, after the report out time frame (as defined in the Google Analytics application) has ended, the initial unique visitor will be treated as a unique visitor again. Individuals who utilize cookies, use more than one web browser on the same computer to access the site, or spoof their IP addresses using proxy servers will consistently be considered unique visitors. The reason for this is because Google Analytics utilizes cookies to keep track of who accesses the artist’s website, in conjunction with the visitor’s IP address. If an individual disables cookies, they will be considered to be a unique visitor each time they visit the site (because no previous record of their accessing the site exists in the Google Analytics records). Individuals who use more than one web browser to access the site (from one computer that has one IP address) will also be counted as unique visitors because Google Analytics does not strictly differentiate unique visitors based on IP addresses. If an individual is spoofing their IP address using proxy servers, their IP address becomes dynamic (meaning that it constantly changes), thereby causing Google Analytics to track their visit(s) to the site as unique—even if they are actually repeat visitors.
The number of repeat visitors is a statistic describing the number of visitors who made multiple visits (after being counted once as a unique visitor) to the artist’s website. Tracking the number of unique and returning visitors enables the artist to view the maximum reach (audience size) of their site (it shows how much traffic they’re getting and how many impressions were generated through their site content). By tracking the number of returning visitors, the artist can see how loyal site visitors are to the artist (this also helps to show if the content on the site is engaging). Knowing how many times people re-visit the artist’s site within a particular time period also helps determine when site content should be updated (so that those visitors stay engaged and continue to come back to the site).
Reports Used To Find This Data:
- New Vs. Returning—This report illustrates how many visits to the artist’s site were new (unique) versus those that were repeat visits.
- Data Shown In This Report Is As Follows:
- The total number of visits to the site
- The number of visits from new visitors
- The percentage of total site visits from new visitors
- The number of visits from repeat visitors
- The percentage of total site visits from repeat visitors
- Data Shown In This Report Is As Follows:
- Absolute Unique Visitors—This report illustrates how many visitors to the artist’s site were absolutely unique (new) versus those that were repeat visitors.
- Data Shown In This Report Is As Follows:
- The number of absolutely unique visitors to the site
- The number of absolutely unique visitors to the site daily
- The percentage of absolutely unique visitors that access the site daily
- Data Shown In This Report Is As Follows:
| Site Click Density/ Site Overlay |
The site click density of a website (also known as site overlay) displays the most important links on each page of the artist’s website (in picture percentage form). It shows the popularity of every link on each page on the site (it enables the artist to see where site visitors are and aren’t clicking). The popularity of each link is depicted by having small bars located beneath the link, which display the percentage contribution of each link click to the total number of pages viewed on the entire site. Site click density also illustrates the conversion rate contributions derived from each page link. One caveat is that site click density can not be monitored on pages that use: “javascript links, CSS content, flash navigation, downloadable files (like PDFs), outbound links, frames, auto re-directs, and links using the depreciated “target=”_blank” attribute.”[xi] What this means is that the site click density analysis can only be used on, “static pages with unique links to content located elsewhere on the artist’s website and that it will not work on sites that have dynamically generated content.”[xii] If the site has dynamically generated content on it, the site overlay data will allocate zeros in the report for select links. The most important page on the artist’s site that click density should be monitored on is the home page. The reason why this is the most important page to monitor is because it is, typically, the initial page visitors go to when accessing the site. The home page’s site click density report will help the artist understand the paths visitors take through the site after visiting the home page.
By monitoring the site’s click density, multiple insights can be gained. It shows the navigation paths visitors take while on the site, where they go after visiting the site’s home page, what the most important content (to site visitors) is, which links are and are not clicked on, and how effective links on each page are at achieving conversions. If it is noticed that certain links, that have been deemed important, are not generating as many clicks as they should, investigation must be done as of to why this has occurred and will help optimize the website and make it more visitor friendly. The link’s description (copy) on the site might need to be changed, so that it makes more sense to site visitors. If the link isn’t deemed to be that important, it might be wise to move it somewhere else on the site and replace it with a link that is perceived to be more important. If the link really provides no value to the artist, it might be wise to just remove the link from the site all together.
Reports Used To Find This Data:
- Site Overlay—This report illustrates how many clicks each link on the site gets.
- Data Shown In This Report Is As Follows:
- The popularity of each link on the site
- The percentage contribution of each link click to the total number of pages viewed on the entire site
- The conversion rate contributions derived from each page link
- Data Shown In This Report Is As Follows:
| What Sites Analytics Can Be Used On |
Analytics can be used on a variety of sites. Including WordPress, hard coded websites, and social networking sites, to name a few. Below is a detailed description of sites that Analytics can be tracked on.
| Sites That Analytics Can Be Tracked From |
Analytics information can be tracked from the artist’s personal website, as well as, on each of the artist’s respective social networking sites. The primary focus of this paper, so far, was about how to utilize Google Analytics on and interpret the data from the artist’s personal website. Instructions on how to analyze and interpret the artist’s website analytics data can be found in the Google Analytics report out template, which is located in the appendix. The following section provides information about utilizing analytics on the most pertinent social networking sites that the artist should have pages on.
| Social Networking Sites |
Facebook is the number one social networking site in the world (with 93,300,000 monthly visitors), followed by MySpace (which has 61,300,000 monthly visitors) and Twitter (which has 28,000,000 monthly visitors).[xiii] More recently, Facebook surpassed Google as the most visited site on the internet in the United States.
Facebook is a social network that, “connects people with friends and others who work, study, and live around them. People use Facebook to keep up with friends, upload photos, share links and videos, and learn more about the people they meet.”[xiv] Its pages are for Facebook users to showcase their personality, and display their likes, and dislikes to their friends. Most artists have (and if they don’t—they should have) a Facebook fan page. The fan page does four things for an artist: (1) it helps artists gain more exposure (through fan pages being posted on each Facebook user’s profile), (2) it helps build an artist’s fan community—it enables all fans of that artist to connect with each other, so that they may discuss the artist with like minded individuals (it, for the most part, acts as a virtual fan club), (3) it enhances the artist—fan relationship (it helps the artist disseminate information about themselves, it helps them keep fans updated about upcoming events, and acts as a streaming music distribution outlet to everyone who cares to be their fan—this isn’t a one way interaction though—artists aren’t just pushing content out to fans, like they would with an email or newsletter, they can also receive content and feedback from fans as well—that’s the heart of what Facebook fan pages do to enhance the artist-fan relationship) and (4) it helps the artist gain insights into who their fan base is comprised of (through their “Insights” page).
MySpace, on the other hand, is a social networking site that acts as a, “venue for aspiring musicians and bands to share music and concert dates.”[xv] Although individuals can have personal MySpace pages (which feature content similar to that of personal Facebook pages), MySpace’s music pages play a major part in artists’ careers. When MySpace music pages were first developed, it was considered to be a good opportunity for artists to get exposure and catch the eye of industry A&R professionals. Throughout the years though, the number of MySpace’s music pages have grown too large (currently there are 8 million+ music pages on MySpace) and too many under-developed artists have registered, which has caused intense clutter and has reduced its efficiency for catching industry professionals and potential fans’ attention. This clutter has essentially caused MySpace to currently provide three primary services to artists: (1) it enables artists to connect with current fans (and based on other promotional efforts, gain new ones), (2) it serves as a virtual press kit, and (3) it helps the artist gain insights into who their page visitors and fans are (through the “Artist Dashboard” page). Although opportunities for discovery on MySpace have been severely reduced in the past few years, it is still a major social networking site that shouldn’t be ignored. If an artist does not have a MySpace page, they lose out on the opportunity to potentially gain additional promotion for their work and they also give an impression of not actually being a professional musician (because all artists, who are serious about their careers, have pages on all major social networking sites because they recognize the importance based on the benefits offered), furthermore, musicians also lose out on another opportunity to further understand who their music appeals to.
Twitter, the third most popular social networking utility, “is a real-time information network powered by people all around the world that lets users share and discover what’s happening, when its happening.”[xvi] Twitter, like with Facebook and MySpace pages, enables the artist-fan relationship to grow by facilitating two-way communication. Artists post updates about what they’re doing and fans choose to follow them, so that they can stay informed about the artist’s activities. Twitter also facilitates communication between fans and artists, by allowing fans to directly contact artists by sending them messages. The three main benefits of utilizing the Twitter service are: (1) it enables the artist-fan relationship to grow (via tweet status updates and direct messages), (2) it assists the artist with self-promotion (via tweets and re-tweets by followers), and (3) it provides pertinent information about their followers (a.k.a. fans). Although Facebook and MySpace have dedicated analytics applications for artists, Twitter does not. However, there are many twitalytics programs and websites out there for artists to access information about their followers. The three best twitalytics website programs are: Twitter Analyzer, Tweet Effect, and Tweet Stats. Each of these website programs provide a variety of different information, that benefit the artist. Below, is a detailed discussion about the data insights one can gain from utilizing the Facebook “Insights” page, MySpace’s “Artist Dashboard,” and the three twitalytics web programs mentioned above.
Using these sites creates a two-way interaction between the artist and fan. Above all else this is the most important reason for an artist to participate in social networking because it helps to create and maintain an emotional connection between the artist and their fans. As with the artist’s website, each of the artist’s social networking sites’ content must be equally engaging in order for it to provide substantial career benefits to them. Instructions on how to analyze and interpret social networking analytics data can be found in the Facebook, MySpace, and Twitalytics report out templates, which are located in the appendix.
| Facebook Fan Page |
Facebook’s fan pages have a section dedicated to analytics called “Insights.” The Insights page is only visible to administrators of the page and is located below the information section on the page’s left side. To access the Insights page one must click the “See All” hyperlink. The data shown on the Insights page is listed in bullet point form (for easy reading) below.
- The total number of fans who interact with the artist’s fan page, including the:
- Total number of interactions fans had with the page (how many times they posted something, commented on something, or “Liked” something that was posted on the page)
- Number of interactions per post (how many times fans interacted with each of the artist’s postings to the page)
- Post Quality (post quality is derived from how many fans interacted with that particular post)
- Number of Posts (made by fans of the artist’s page)
- Number of Discussion Posts (this is the number of fans who created discussions on the fan page)
- Demographics (the age and sex of the page’s fans—including a break down of the number and percentage of fans in each age category)
- Geographical Data
- Top Countries (where fans are located)
- Top Cities (where fans are located)
- Top Languages (that fans speak)
- Total number of fans & total number of unsubscribed fans
- Number of Page Views
- Media Consumption
- Number of Audio & Video Plays & Photo Views
| MySpace Band Page |
MySpace’s band pages have a section dedicated to analytics called “Artist Dashboard.” The Artist Dashboard page is only visible to bands who have properly registered their MySpace profile site as a band page (instead of a personal profile page) and to administrators of the page. Once the artist or account administrator has logged in to the MySpace account, on the right side of the landing page will be a section that says “Artist Dashboard.” To access the Artist Dashboard page the “View All Stats” hyperlink must be clicked. The data shown on the Artist Dashboard page is listed in bullet point form (for easy reading) below.
- The Artist Dashboard Page shows the following:
- Trends in Song Plays, Profile Views, and Friends
- Number of Song plays (over time)
- Number of Profile views (over time)
- Number of Friends (over time)
- Demographics (the age and sex of the page’s friends and visitors—including a break down of the number and percentage of fans in each age category)
- Song Statistics
- Shows which songs were streamed the most by MySpace page visitors
- Geographical Data
- Top Countries (where friends and visitors are located)
- Top States (where friends and visitors are located)
- Top Cities (where friends and visitors are located)
- Blog Post Statistics
- Number of Posts
- Number of Comments
- Number of Views
- Number of Kudos given
| Twitter (Twitalytics) |
Twitter, unlike Facebook and MySpace do not have a section dedicated to monitoring the artist’s Twitter page’s analytics. However, there are many twitalytics programs and websites out there for artists to access information about their followers. The three best twitalytics website programs are: Twitter Analyzer, Tweet Effect, and Tweet Stats. These programs are easy to use, no account registration is required (so anyone can access this information about the artist’s Twitter page and information about competing artists’ follower data can also be viewed), and they each show a plethora of different analytical data that is all equally valuable to the artist. In order to access the data one must go to each of the websites and type in the artist’s Twitter user name. The data shown via each respective program is listed in bullet point form (for easy reading) below.
| Twitter Analyzer (TwitterAnalyzer.com) |
- User Data:
- Shows the rate of daily tweets
- Shows the volume of tweets, re-tweets, and reader counts for each message
- Shows Daily Popularity Rate—how many times the artist has been mentioned on Twitter
- Shows Daily Reach Rate—how many readers have been exposed to the artist’s messages
- Shows the Top Subjects the artist is tweeting about
- Shows the Top Hash Tags the artist is tweeting about
- Shows the Top Links the artist publishes
- Shows the Top Apps the artist is using to Tweet
- Friends Data:
- Shows the Real Time representation of the artist’s followers who are currently on Twitter
- Shows Followers Growth Rate—how many new followers the artist acquires or loses daily
- Shows Followers Density Map—shows the artist’s followers’ locations (by country only)
- Shows Followers’ Activity on Twitter—displays how active the artist’s followers are on Twitter
- Shows Re-Tweeting Friends—displays who re-tweets the artist’s tweets the most
- Mentions Data:
- Shows who has mentioned the artist
- Shows who the artist’s mentioned
- Group Data:
- Groups By Occupation—shows the jobs the artist’s followers have
- Groups By Join Date/Groups By Popularity—a representation of followers’ join dates to Twitter
- Groups By Gender—shows how many followers are male and how many are female
- Groups By Actions—shows what subjects the artist’s followers are tweeting about the most
| Tweet Effect (TweetEffect.com) |
Tweet Effect is a very simplistic program. It strictly shows which of the artist’s last 200 Twitter updates made people follow or stop following them. This program is good to check to see if the artist’s post quality is gaining or losing followers and momentum. Another reason why this particular statistic should be monitored is that it shows the actual tweet content and dates of when individuals started following or stopped following the artist. Knowing these things will help the artist or artist manager know what subjects should be tweeted about less (or never) or more (because they either negatively or positively effected the amount of the artist’s followers). One thing that this statistic also shows is if the artist started losing followers on days that they tweeted extensively. If this is noticed, then the artist should stop tweeting as frequently as he did on that particular date (when he lost the most followers) and also should look at the tweet content for that date as well, in order to determine whether it was the tweet content and not the tweet frequency that alienated followers (after analyzing those two things in conjunction with one another, an educated decision about tweet frequency changes can be made).
| Tweet Stats (TweetStats.com) |
Tweet Stats is another simplistic, yet data heavy, analytics information source. Data provided by this program shows:
- The artist’s Tweet Timeline—their number of tweets per day (over time)
- Tweet Density—when the artist tweets the most
- Aggregate Daily Tweets
- Aggregate Hourly Tweets
- Replies to people who @ (direct) messaged the artist
- Interface Used—what interface the artist most frequently use to tweet
- Who the artist Re-Tweets
| Conclusion |
| Summary |
Analytics helps an artist determine who interacts with their digital properties. It helps an artist or artist manager gain a better understanding of who their consumers are and how they behave. Analytics data interpretation helps an artist determine if their website is engaging or has problems and also assists with maximizing the effectiveness of marketing, promotional, and touring strategies. The immense benefits analytics insights provide can substantially impact an artist’s career, as well as, can provide them with a strategic competitive advantage over other artists.
In order for an analytics strategy to be effective and have a positive impact on an artist’s career, campaign achievement goals must be set and analytics data should be interpreted on a bi-weekly basis. Campaign achievement goals must be set so that the effectiveness of analytics on an artist’s career (and their subsequent objectives) can be monitored. Analytics data should be interpreted on a bi-weekly basis so that an artist can track trends and have current information about their consumers’ behaviors and desires. Bi-weekly interpretation also helps an artist know if there are problems with their site and helps them to identify changes that need to be made, in order for it to be effective at promoting the artist and their career. If content changes driven by analytics interpretation occur, bi-weekly report outs help determine the effectiveness and impact of those changes on the artist and the artist’s site.
Analytics is not a buzzword. It is a serious marketing strategy that can give an artist an immense competitive edge over their peers. Analytics (non-digital) drive all decisions made in the business world. It is because of this that all serious musicians should invest in an analytics campaign. This paper outlined the primary reasons why an artist should utilize analytics, as well as, provided information about how analytics can be interpreted (without hiring an individual or company to do it on the artist’s behalf). The appendices address additional reports that were not included in the paper, as well as, have analytics report out templates to assist with DIY interpretation.
[i]Baskerville, David. Music Business Handbook & Career Guide. London: Sage Publications Ltd, 2006.
[ii] Baskerville, David. Music Business Handbook & Career Guide. London: Sage Publications Ltd, 2006.
[iii] Modern Music Marketing Basics. 23 March 2010. Hypebot.com. 23 March 2010. <http://www.hypebot.com/hypebot/2010/03/-modern-music-marketing-basics.html>.
[iv] The Orchard Launches Comprehensive Analytics Tool. 18 March 2010. The Daily Rind. 22 March 2010. <http://www.dailyrindblog.com/?p=842>.
[v] The Orchard Launches Comprehensive Analytics Tool. 18 March 2010. The Daily Rind. 22 March 2010. <http://www.dailyrindblog.com/?p=842>.
[vi] The Orchard Launches Comprehensive Analytics Tool. 18 March 2010. The Daily Rind. 22 March 2010. <http://www.dailyrindblog.com/?p=842>.
[vii] The Orchard Launches Comprehensive Analytics Tool. 18 March 2010. The Daily Rind. 22 March 2010. <http://www.dailyrindblog.com/?p=842>.
[viii] Davenport, Thomas. Competing on Analytics: The New Science of Winning. Boston: Harvard Business Press, 2007.
[ix] Davenport, Thomas. Competing on Analytics: The New Science of Winning. Boston: Harvard Business Press, 2007.
[x] Davenport, Thomas. Competing on Analytics: The New Science of Winning. Boston: Harvard Business Press, 2007.
[xi] Ledford, Jerri & Mary Tyler. Google Analytics 2.0. New York: Wiley Publishing Inc., 2007.
[xii] Site Overlay Is Not Working. Why Not? 8 Aug. 2009. Google Analytics Experts From Epik One. 3 May 2010. <http://www.analyticsexperts.com/google-analytics/knowledge-base-faq/site-overlay-is-not-working-why-not-posted-882008/>.
[xiii] Top 20 Most Popular Social Networking Websites: April 2010. 1 April 2010. eBizMBA.com. 4 April 2010. <http://www.ebizmba.com/articles/social-networking-websites>.
[xiv] Facebook. 19 Nov. 2009. Answers.com. 3 April 2010. <http://www.answers.com/topic/facebook>.
[xv] What Is MySpace? 26 April 2006. TechTarget.com. 7 March 2010. <http://whatis.techtarget.com/definition/0,,sid9_gci1177951,00.html>.
[xvi] About Twitter. 1 Jan 2010. Twitter. 3 March 2010. <http://twitter.com/about>.